Organisation of Data
Studying this chapter should enable you to:
- classify the data for further statistical analysis;
- distinguish between quantitative and qualitative classification;
- prepare a frequency distribution table;
- know the technique of forming classes;
- be familiar with the method of tally marking;
- differentiate between univariate and bivariate frequency distributions.
1. INTRODUCTION
In the previous chapter you have learnt about how data is collected. You also came to know the difference between census and sampling. In this chapter, you will know how the data, that you collected, are to be classified. The purpose of classifying raw data is to bring order in them so that they can be subjected to further statistical analysis easily.
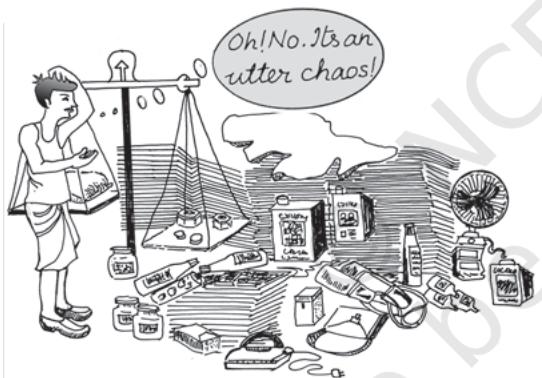
Have you ever observed your local junk dealer or kabadiwallah to whom you sell old newspapers, broken household items, empty glass bottles, plastics, etc? He purchases these things from you and sells them to those who recycle them. But with so much junk in his shop it would be very difficult for him to manage his trade, if he had not organised them properly. To ease his situation he suitably groups or "classifies" various junk. He puts old newspapers together and
ties them with a rope. Then collects all empty glass bottles in a sack. He heaps the articles of metals in one corner of his shop and sorts them into groups like "iron", "copper", "aluminium", "brass" etc., and so on. In this way he groups his junk into different classes "newspapers, "plastics", "glass", "metals" etc. — and brings order in them. Once his junk is arranged and classified, it becomes easier for him to find a particular item that a buyer may demand.
Likewise when you arrange your schoolbooks in a certain order, it becomes easier for you to handle them. You may classify them according to subjects where each subject becomes a group or a class. So, when you need a particular book on history, for instance, all you need to do is to search that book in the group "History". Otherwise, you would have to search through your entire collection to find the particular book you are looking for.
While classification of objects or things saves our valuable time and effort, it is not done in an arbitrary manner. The kabadiwallah groups his junk according to the markets for reused goods. For example, under the group "Glass" he would put empty bottles, broken mirrors and windowpanes, etc. Similarly when you classify your history books under the group "History" you would not put a book of a different subject in that group. Otherwise the entire purpose of grouping would be lost. Classification, therefore, is arranging or organising things into groups or classes based on some criteria.
Activity
Visit your local post-office to find out how letters are sorted. Do you know what the pin-code in a letter indicates? Ask your postman.
2. RAW DATA
Like the kabadiwallah's junk, the unclassified data or raw data are highly disorganised. They are often very large and cumbersome to handle. To draw meaningful conclusions from them is a tedious task because they do not yield to statistical methods easily. Therefore proper organisation and presentation of such data is needed before any systematic statistical analysis is undertaken. Hence after collecting data the next step is to organise and present them in a classified form.
Suppose you want to know the performance of students in mathematics and you have collected data on marks in mathematics of 100 students of your school. If you present
them as a table, they may appear something like Table 3.1.
TABLE 3.1 Marks in Mathematics Obtained by 100 Students in an Examination
| 47 | 45 | 10 | 60 55 | 51 62 | 56 | 66 | 100 | 49 | 40 |
|---|---|---|---|---|---|---|---|---|---|
| 60 | 59 | 56 64 | 66 | 50 | 48 59 | 59 | 55 65 | 51 | 41 |
| 42 | 69 | 17 | 56 | 57 | 62 | 50 | |||
| 64 | 30 | 37 | 75 | 20 | 14 | 55 | 90 | ||
| 62 | 51 | 55 | 14 | 25 | 34 | 90 | 49 | 56 | 54 |
| 70 | 47 | 49 | 82 | 40 | 82 | 60 | 85 | 65 | 66 |
| 49 | 44 | 64 | 69 | 70 | 48 | 12 | 28 | 55 | 65 |
| 49 | 40 | 25 | 41 | 71 | 80 | 0 | 56 | 14 | 22 |
| 66 | 53 | 46 | 70 | 43 | 61 | 59 | 12 | 30 | 35 |
| 45 | 44 | 57 | 76 | 82 | 39 | 32 | 14 | 90 | 25 |
Or you could have collected data on the monthly expenditure on food of 50 households in your neighbourhood to know their average expenditure on food. The data collected, in that case, had you presented as a table, would have resembled Table 3.2. Both Tables 3.1 and 3.2 are raw or unclassified data. In both the tables you find that numbers are not arranged in any order. Now if you are asked for the highest marks in mathematics from Table 3.1 then you have to first arrange the marks of 100 students either in ascending or in descending order. That is a tedious task. It becomes more tedious, if instead of 100 you have the marks of 1,000 students to handle. Similarly, in Table 3.2, you would note that it is difficult for you to ascertain the average monthly expenditure of 50 households. And this difficulty will go up manifold if the number was larger say, 5,000 households. Like our kabadiwallah, who would be distressed to find a particular item when his junk becomes large and disarranged, you would face a similar situation when you try to get any information from raw data that are large. In one word, therefore, it is a tedious task to pull information from large unclassified data.
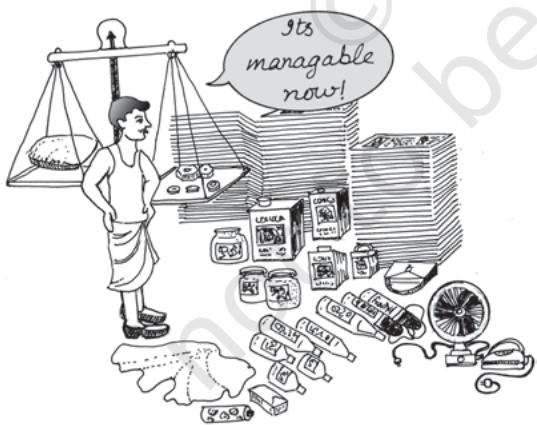
Table 3.2 Monthly Household Expenditure (in Rupees) on Food of 50 Households
| 1904 | 1559 | 3473 | 1735 | 2760 |
|---|---|---|---|---|
| 2041 | 1612 | 1753 | 1855 | 4439 |
| 5090 | 1085 | 1823 | 2346 | 1523 |
| 1211 | 1360 | 1110 | 2152 | 1183 |
| 1218 | 1315 | 1105 | 2628 | 2712 |
| 4248 | 1812 | 1264 | 1183 | 1171 |
| 1007 | 1180 | 1953 | 1137 | 2048 |
| 2025 | 1583 | 1324 | 2621 | 3676 |
| 1397 | 1832 | 1962 | 2177 | 2575 |
| 1293 | 1365 | 1146 | 3222 | 1396 |
The raw data are summarised, and made comprehensible by classification. When facts of similar characteristics are placed in the same class, it enables one to locate them easily, make comparison, and draw inferences without any difficulty. You have
studied in Chapter 2 that the Government of India conducts Census of population every ten years. About 20 crore persons were contacted in Census 2001. The raw data of census are so large and fragmented that it appears an almost impossible task to draw any meaningful conclusion from them. But when the same data is classified according to gender, education, marital status, occupation, etc., the structure and nature of population of India is, then, easily understood.
The raw data consist of observations on variables. The raw data as given in Tables 3.1 and 3.2 consist of observations on a specific or group of variables. Look at Table 3.1 for instance which contains marks in mathematics scored by 100 students. How can we make sense of these marks? The mathematics teacher looking at these marks would be thinking– How have my students done? How many have not passed? How we classify the data depends upon the purpose we have in mind. In this case, the teacher wishes to understand in some depth- how these students have done. She would probably choose to construct the frequency distribution. This is discussed in the next section.
Activity
Collect data of total weekly expenditure of your family for a year and arrange it in a table. See how many observations you have. Arrange the data monthly and find the number of observations.
3. CLASSIFICATION OF DATA
The groups or classes of a classification is done in various ways. Instead of classifying your books according to subjects — "History", "Geography", "Mathematics", "Science", etc. — you could have classified them author-wise in an alphabetical order. Or, you could have also classified them according to the year of publication. The way you want to classify them would depend on your requirement.
Likewise the raw data is classified in various ways depending on the purpose. They can be grouped according to time. Such a classification is known as a Chronological Classification. In such a classification, data are classified either in ascending or in descending order with reference to time such as years, quarters, months, weeks, etc