Overview
This chapter deals with one of the challenges faced by independent India— poverty. After discussing this multidimensional problem through examples, the chapter discusses the way poverty is analysed by social scientists. Poverty trends in India and the world are illustrated through the concept of the poverty line. Causes of poverty as well as anti-poverty measures taken by the government are also discussed. The chapter ends with broadening the official concept of poverty into human poverty.
Introduction
In our daily life, we come across many people who we think are poor. They could be landless labourers in villages or people living in overcrowded jhuggis in cities. NITI Aayog uses Multidimensional
Poverty Index to analyse the problem of poverty faced by the country. The ratio of multidimensional poverty has fallen from approximately 55 per cent in 2005–06, 25 per cent in 2015-16 and to 15 per cent in 2019-21. It is also expected that multidimensional poverty will soon reach single digit.
Two Typical Cases of Poverty
Urban Case
Thirty-three year old Ram Saran works as a daily-wage labourer in a wheat flour mill near Ranchi in Jharkhand. He manages to earn around $\yen 3,500$ a month when he finds employment, which is not often. The money is not enough to sustain his family of six— his
wife and four children aged between 12 years to six months. He has to send money home to his old parents who live in a village near Ramgarh. His father, a landless labourer, and his brother who lives in Hazaribagh depend on Ram Saran for sustenance. Ram Saran lives in a one-room rented house in a crowded basti in the outskirts of the city. It is a temporary shack built of bricks and clay tiles. His wife Santa Devi, works as a part time maid in a few houses and manages to earn another {150o. They manage a meagre meal of dal and rice twice a day, but there is never enough for all of them. His elder son works as a helper in a tea shop to supplement the family's income and earns another $\yen 700$ while his 10-year old daughter goes to school and takes care of the younger siblings. They have only two pairs of hand-me-down clothes each. New ones are bought only when the old clothes become unwearable. Shoes are a luxury. The younger one relishes the dal-rice served at school.
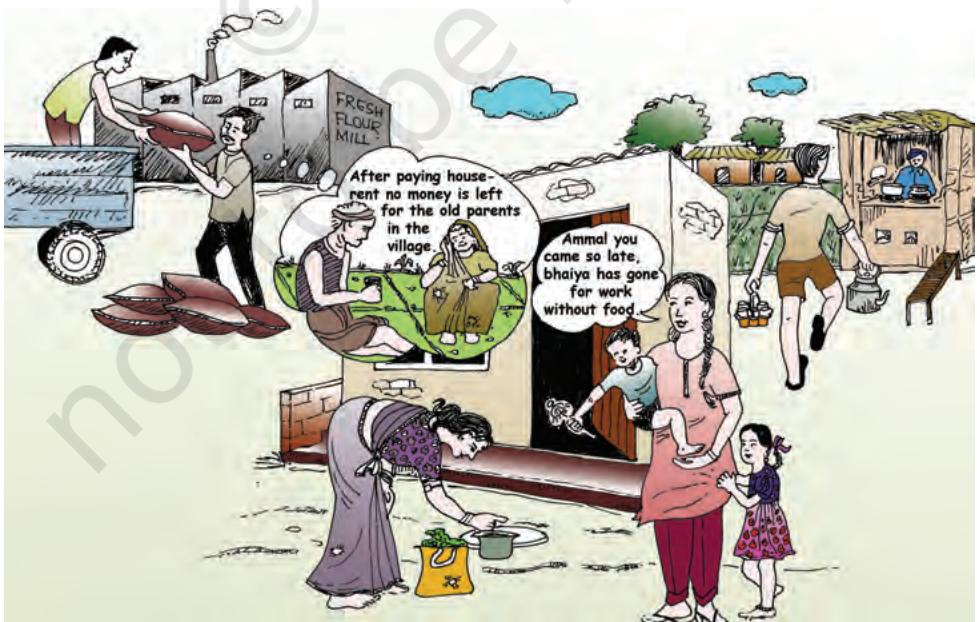 Picture 3.1 Story of Ram Saran
Rural case
Lakha Singh belongs to a small village near Meerut in Uttar Pradesh. His family does not own any land. So, they do odd jobs for the big farmers. Work is erratic and so is income. At times they get paid $\yen 200$ for a hard day's work. But often it is in kind like a few kilograms of wheat or dal or even vegetables for toiling in the farm throughout the day. The family of six are barely able to manage two square meals a day. Lakha lives in a kuchha hut on the outskirts of the village. The women of the family spend the day chopping fodder and collecting firewood in the fields. His father, a tuberculosis patient, passed away two years ago due to lack of medication. His mother now suffers from the same disease and life is slowly ebbing away. Although, the village has a primary school, Lakha never went there but he is happy to find his children going to school. New clothes happen once in a few years. Even soap and oil are a luxury for the family.
Study the above cases of poverty and discuss the following issues related to poverty:
- Landlessness Unemployment Size of families
- Literacy levels
- Health/nutrition
- Helplessness
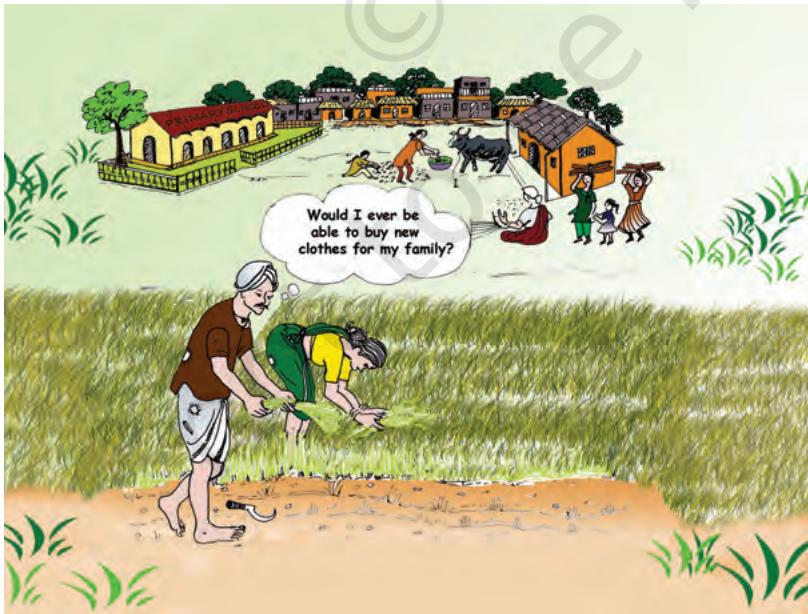 Picture 3.2 Story of Lakha Singh
These two typical cases illustrate many dimensions of poverty. They show that poverty means hunger and lack of shelter. This also speaks about a situation in which parents are not able to give their children nutritious food three times a day or a situation where sick people cannot afford treatment. Poverty also means lack of clean water and sanitation facilities. It also means lack of a regular job with decent minimum wages. Above all, it means living with a sense of helplessness. Poor people are in a situation in which they are ill-treated at almost every place, in farms, factories, government offices, hospitals, railway stations, etc. Obviously, nobody would like to live in poverty.
One of the biggest challenges of independent India has been to bring millions of its people out of abject poverty. Mahatma Gandhi said that India would be truly independent only when the poorest of its people become free of human suffering.
Poverty as seen by social scientists Since poverty has many facets, social scientists look at it through a variety of indicators. Usually the indicators are used to relate with the levels of income and consumption. In recent times, a variety of other indicators have also been used to recognise whether a person is poor or not. For example, National Multidimensional Poverty Index is calculated on the basis of three broad indicators: health indicators like nutrition, child and adolescent mortality, maternal health. Education indicators like years of schooling and school attendance, and standard of living indicator like cooking fuel, sanitation, drinking water, housing, electricity, assets, bank account. Indicators such as social exclusion and vulnerability are also used to understand poverty (see box).
Social Exclusion
According to this concept, poverty must be seen in terms of the poor having to live only in a poor surrounding with other poor people, excluded from enjoying social equality of better-off people in better surroundings. Social exclusion can be both a cause as well as a consequence of poverty in the usual sense. Broadly, it is a process through which individuals or groups are excluded from facilities, benefits and opportunities that others (the "better-offs") enjoy. A typical example is the working of the caste system in India in which people belonging to certain castes are excluded from equal opportunities. Social exclusion thus may lead to or can cause more damage than having a very low income.
Vulnerability
Vulnerability to poverty is a measure, which describes the greater probability of certain communities (say, members of a backward caste) or individuals (such as a widow' or aphysically handicapped person) of becoming or remaining poor. Vulnerability is determined by the options available to different communities for finding an alternative living in terms of assets, education, health and job opportunities. Further, it is analysed on the basis of the greater risks these groups face at the time of natural disasters (earthquakes, tsunami). Additional analysis is made of their social and economic ability to handle these risks. In fact, vulnerability describes the greater probability of being more adversely affected than other people when bad time comes for everybody, whether a flood or an earthquake or simply a fall in the availability of jobs!
Poverty Line
At the centre of the discussion on poverty is the concept of the 'poverty line'. A common method used to measure poverty is based on the income or consumption levels. The term 'consumption' means the amount spent on various items such as food, clothing, etc., by a family. A person is considered poor if his or her income or consumption level falls below a given 'minimum level' necessary to fulfill the basic needs. What is necessary to satisfy basic needs is different at different times and in different countries. Therefore, poverty line may vary with time and place. Each country uses an imaginary line that is considered appropriate for its existing level of development and its accepted minimum social norms. For example, a person not having a car in the United States may be considered poor. In India, owning a car is still considered a luxury.
While determining the poverty line in India, till a few years ago, a minimum level of food requirement, clothing, footwear, fuel and electricity, educational and medical needs, etc., were taken into consideration. The physical quantities of these needs were multiplied by their prices in rupees. The formula for food requirement while estimating the poverty line was based on the desired calorie requirement. Food items, such as cereals, pulses, vegetables, milk, oil, sugar, etc., together provided these needed calories. The calorie needs vary depending on age, sex and the type of work that a person does. The accepted average calorie requirement in India was 2400 calories per person per day in rural areas and 2100 calories per person per day in urban areas. Since people living in rural areas engage themselves in more physical work, calorie requirements in rural areas were considered to be higher than in urban areas. The bare monetary expenditure per capita needed for buying these calorie requirements in terms of food grains, etc., and reported by families has been considered as poverty line. This amount was revised periodically, taking into consideration the rise in prices.
Based on the global developments, the Government of India has begun to estimate the proportion of poor in India using 12 developmental indicators, which is popularly known as Multidimensional Poverty Index (see box). This national index complements the income or consumption expenditure based poverty measurement because it measures and compares deprivations directly.
Let's Discuss
Discuss the following:
- What could be the difference between consumption-based expenditure Poverty Line and National Multidimensional Poverty Index?
- What do you think would be the "minimum necessary level" in your locality?
Poverty Estimates
Based on the methodology described in the previous section, the number and proportion of poor people in India, called Head Count Ratio (HCR), is estimated. Table 3.1 shows that during the 1990s, the proportion of 'consumption expenditure based' poor declined from 45 to 37 per cent. However, the number of poor remained at about 40 crores. During 2000-2011, both the proportion and the number of poor declined. The proportion of multidimensional poor during 2015-2021 declined from 25 to 15 percent. As per the official record, 13.5 crore people have escaped multidimensional poverty during this period. Specifically deprivation against various indicators have declined more sharply in rural areas than in urban areas.
Table 3.1: Estimates of Poverty in India 1993 – 2019
| Year | Head Count Ratio (%) | Number of poor (in millions) | ||||
|---|---|---|---|---|---|---|
| Rural | Urban | Total | Rural | Urban | Combined | |
| Consumption-based | ||||||
| 1993-94 | 50 | 32 | 45 | 329 | 75 | 404 |
| 2004-05 | 42 | 26 | 37 | 326 | 81 | 407 |
| 2009-10 | 34 | 21 | 30 | 278 | 76 | 355 |
| 2011-12 | 26 | 14 | 22 | 217 | 53 | 270 |
| Multidimensional (Indicator) based | ||||||
| 2015-16 | 32.6 | 8.7 | 25 | NA | NA | NA |
| 2019-21 | 19.3 | 5.3 | 15 | NA | NA | NA |
Source: India in figures, 2018, Government of India Central Statistics office, niti.gov.in/state-statistics (accessed on Nov. 15, 2021); National Multidimensional Poverty Index: A Progress Review 2023, NITI Aayog, Government of India.
Twelve Indicators of National Multidimensional Poverty Index NITI Aayog, a Government of India organisation evolved the National Multidimensional Poverty Index (NMPI) using the following 12 indicators. If an individual is found deprived on these indicators, he or she is considered as multidimensional poor.
Nutrition: A household is considered deprived if any child between the ages of 0 to 59 months, or woman between the ages of 15 to 49 years, or man between the ages of 15 to 54 years is found to be undernourished.
Child-Adolescent Mortality: A household is deprived if any child or adolescent under 18 years of age has died in the household in the five-year period preceding the survey.
Maternal Health: A household is deprived if any woman in the household who has given birth in the 5 years preceding the survey has not received assistance from trained skilled medical personnel during the recent childbirth.
Years of Schooling: A household is deprived if not even one member of the household aged 10 years or older has completed six years of schooling.
School attendance: A household is deprived if any school-aged child is not attending school up to the age at which he/she would complete class.
Cooking Fuel: A household is deprived if a household cooks with dung. agricultural crops, shrubs, wood, charcoal, or coal.
Sanitation: A household is deprived if the household has unimproved or no sanitation facility or it is improved but shared with other households.
Drinking Water: A household is deprived if the household does not have access to improved drinking water or safe drinking water is at least a 30-minute walk from home (as a round trip).
Housing: A household is deprived if the household has inadequate housing: the floor is made of natural materials, or the roof or wall are made of rudimentary materials.
Electricity: A household is deprived if the household has no electricity.
Assets: A household is deprived if the household does not own more than one of these assets: radio, TV, telephone, computer, animal cart, bicycle, motorbike, or refrigerator; and does not own a car or truck.
Bank Account: A household is deprived if no household member has a bank account or a post office account.
Study Table 3.1 and answer the following questions:
- Even if poverty ratio declined between 1993-94 and 2004-05, why did the number of poor remain at about 407 million?
- Are the dynamics of poverty reduction the same in rural and urban India?
Study the Graph 3.1 and do the following:
Let's Discuss
- Identify the three states where the HCR is the highest.
- Identify the three states where HCR is the lowest.
- List the states which have HCR lower or higher than HCR for all India.
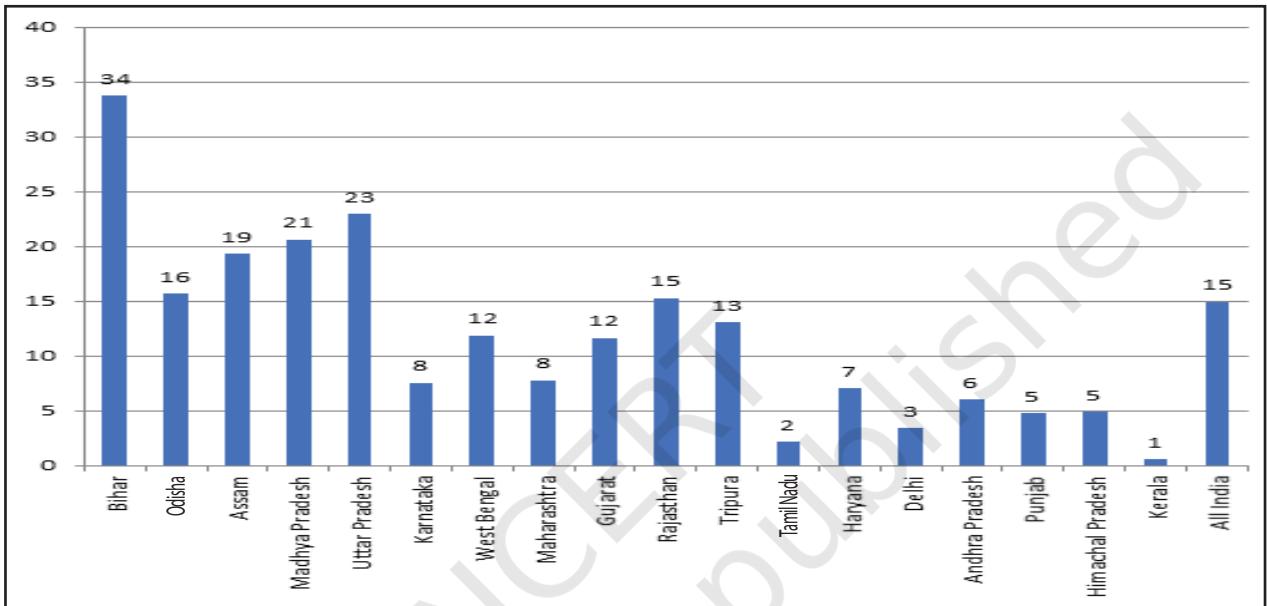 Graph 3.1: Head Count Ratio in selected Indian States, 2019 – 21
Source: https://www.niti.gov.in/sites/default/files/2023-08/India-National-Multidimentional Poverty-Index-2023.pdf
Graph 3.1: Head Count Ratio in selected Indian States, 2019 – 21
Source: https://www.niti.gov.in/sites/default/files/2023-08/India-National-Multidimentional Poverty-Index-2023.pdf
Inter-State Disparities
Poverty in India also has another aspect or dimension. The proportion of poor people is not the same in every state (see graph 3.1). Although state level poverty has witnessed a significant decline from the levels of early seventies, the success rate of reducing poverty varies from state to state. It is pertinent to note that the states of Karnataka, Tamil Nadu, Delhi, Punjab, Himachal Pradesh, Andhra Pradesh, Haryana and Maharashtra had an HCR which was less than 10 per cent in 2019– 21. In the meantime, remarkable strides have been made by States like Bihar, Uttar Pradesh, Madhya Pradesh and Rajasthan. Studies also show states following different steps to reduce poverty. For example, Kerala has focused more on human resource development. In West Bengal land reform measures have helped in reducing poverty. In Andhra Pradesh and Tamil Nadu public distribution of food grains have been responsible for the improvement.
Vulnerable Groups
The proportion of people below poverty line is also not same for all social groups and economic categories in India. Social groups, which are most vulnerable to poverty are Scheduled Caste and Scheduled Tribe households. Similarly, among the economic groups, the most vulnerable groups are the rural agricultural-labour households and the urban casual-labour households. Graph 3.2 shows the percentage of poor people
in all these groups. Although the average of people below poverty line for all groups in India is 22; however, 43 out of 100 (see graph 3.2) people belonging to Scheduled Tribes are not able to meet their basic needs. Similarly, 34 per cent of casual workers in urban areas are below poverty line. About 34 per cent of casual farm labour (in rural areas) and 29 per cent of Scheduled Castes are also poor. The double disadvantage of being a landless casual wage labour household in the socially disadvantaged social groups of the scheduled caste or the scheduled tribe population highlights the seriousness of the problem. Some recent studies have shown that except for the scheduled tribe households, all the other three groups (i.e., Scheduled Castes, rural agricultural labourers and the urban casual labour households) have seen a decline in poverty in the 1990s.
Apart from these social groups, there is also inequality of incomes within a family. In poor families all suffer, but some suffer more than others. In some cases, women, elderly people and female infants are denied equal access to resources available to the family.
Global Poverty Scenario
Is India the only country having poor people? For making comparisons between developing countries, many international organisations like the World Bank use a uniform standard for the poverty line: minimum availability of the equivalent of dollar 2.15 per person per day. The proportion of people in different countries living in extreme economic poverty— defined by the World Bank as living on less than dollar 2.15 per day— has fallen from 16.27 per cent in 2010 to 9.05 per cent in 2019. Why dollar 1 (dollar) has been used there? In India, we use rupee as a national currency, each country has its own currency. American dollar is used by international agencies to compare data across countries.
Although there has been a substantial reduction in global poverty, it is marked with great regional differences. Poverty declined substantially in China and Southeast Asian countries as a result of rapid economic growth and massive investments in human resource development (Read table 3.2 and graph 3.3 and 3.4). The proportion of poor in China has become 0.l per cent in 2020. The World Bank reports reveal that in the countries of South Asia (India, Pakistan,
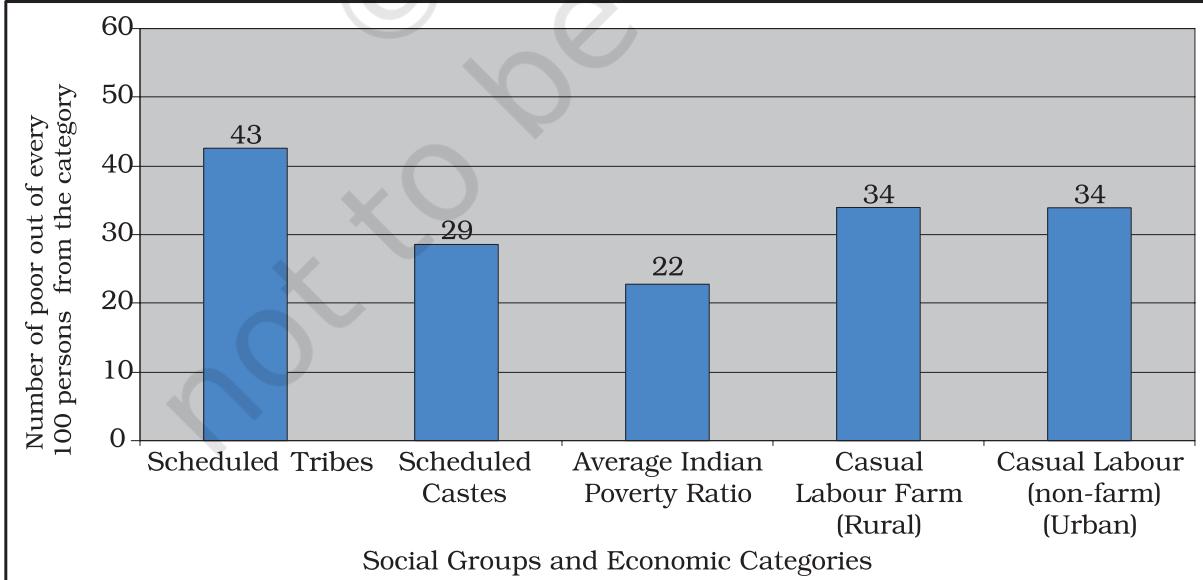 Graph 3.2: Poverty in India 2011–12: Most Vulnerable Groups
Source: www.worldbank.org/2016/India-s-Poverty-Profile (accessed on 29.09.2021)
Graph 3.2: Poverty in India 2011–12: Most Vulnerable Groups
Source: www.worldbank.org/2016/India-s-Poverty-Profile (accessed on 29.09.2021)
Sri Lanka, Nepal, Bangladesh, Bhutan, Afghanistan and Maldives) the decline has also been rapid from 13 per cent in 2017 to 11 per cent in 2021. With decline in the percentage of the poor, the number of poor has also declined significantly from 233 million in 2017 to 207 million in 2021.
Table 3.2: Head Count Ratio Comparison among Some Selected Countries
| Country | % of Population below $2.15 a day (2017 PPP) |
|---|---|
| 1. Nigeria | 30.9 (2018) |
| 2. Bangladesh | 9.6 (2022) |
| 3. India | 11.9 (2021) |
| 4. Pakistan | 4.9 (2018) |
| 5. China | 0.1 (2020) |
| 6. Brazil | 5.8 (2021) |
| 7. Indonesia | 2.5 (2022) |
| 8. Sri Lanka | 1.0 (2019) |
Source: Poverty and Equity Database, World Bank Data; (databank.worldbank.org)
In Sub-Saharan Africa, poverty in fact has declined from 36.6 per cent in 2017 to 35 per cent in 2019 (see graph 3.3). In Latin America and Caribbean, the ratio of poverty has increased from 4.4 per cent in 2017 to 4.6 per cent in 2021. Poverty has also resurfaced at 3 per cent in 2000 in some of the former socialist countries like Russia, where officially it was non-existent earlier.
Let's Discuss
Study Graphs 3.3 and 3.4 and do the following:
- Identify the areas of the world where poverty ratios have declined.
- Identify the area of the globe which has the largest concentration of the poor. Why do different countries use different poverty lines?
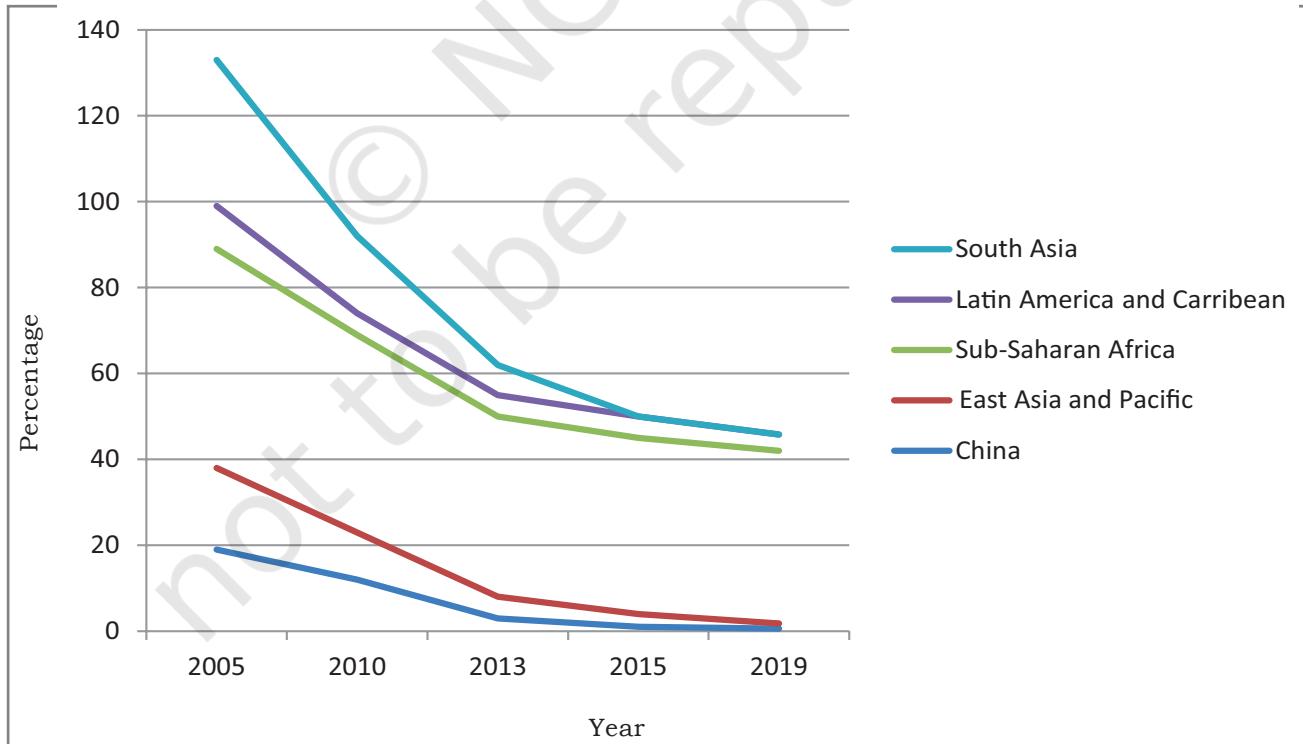 Graph 3.3: Share of people living on a day, 2005–2019
Source: Poverty and Equity Database; World Bank (http://databank.worldbank.org/data/reports.aspx?source $\mathbf { = }$ poverty-and-equity-database)
Graph 3.3: Share of people living on a day, 2005–2019
Source: Poverty and Equity Database; World Bank (http://databank.worldbank.org/data/reports.aspx?source $\mathbf { = }$ poverty-and-equity-database)
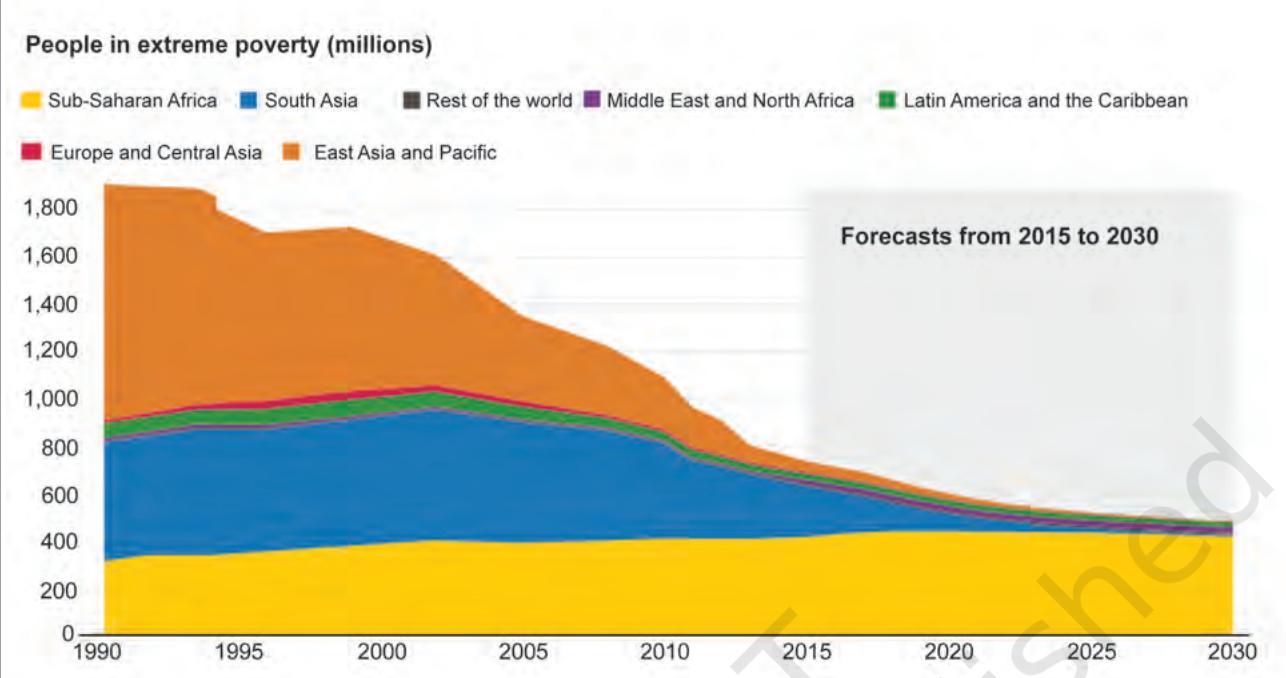
Graph 3.4: Number of poor by region in millions By 2030, forecasts indicate that nearly $_{9 \mathrm{in10}}$ of the extreme poor will live in Sub-Saharan Africa.
Source: World Bank PovcalNet and Poverty & Equity Data Portal (http://databank.worldbank.org/data/reports.aspx?source $=$ poverty-and-equity-database)
Poverty and Sustainable Development Goals
The new Sustainable Development Goals of the United Nations (UN) propose ending poverty of all types by 2030. It provides a shared blueprint for peace and prosperity for people and the planet, now and into the future. At its centre point are the 17 Sustainable Development Goals (SDGs). This requires urgent action from the part of both the developed and the developing countries (see box).
Developed countries ought to support the developing countries in the endeavour of ending poverty, improve health and education, reduce inequalities, tackling climate change and promote sustainable development.
The United Nations (UN) Organisation, an international organisation works with many countries to eradicate poverty. In collaboration with governments of member countries, UN came out with 17 Sustainable Development Goals (SDGs) to be achieved by 2030. They are given in the form of infographics on the next page. Each goal was split into various targets to be achieved by the countries who are members of UN. One of the targets of SDG 1 is reducing the proportion of men, women and children in all ages living in poverty in all its dimensions at least to half by 2030. The decline in the proportion of poor reflects India's commitment to achieve the target related to Goal 1: No Poverty (End poverty in all its forms everywhere).
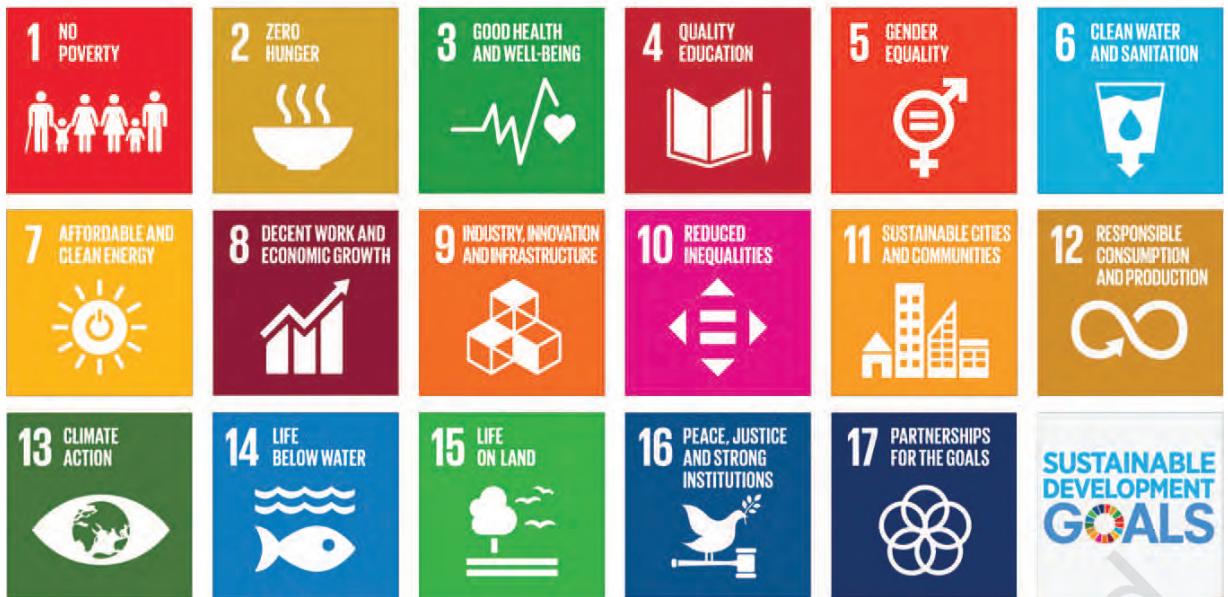 Source: https://sdgs.un.org/goals
Take the help of your teacher and gather the details of each SDG. Do a project report on how your country/ state is achieving these goals.
Causes of Poverty
There were number of causes for the widespread poverty in India. One historical reason is the low level of economic development under the British colonial administration. The policies of the colonial government ruined traditional handicrafts and discouraged development of industries like textiles. The low rate of growth persisted until the 1980s. This resulted in less job opportunities and low growth rate of incomes. This was accompanied by a high growth of population.
With the spread of irrigation and the Green Revolution, many job opportunities were created in the agriculture sector. But the impact was limited to some parts of India. The industries, both in the public and the private sector, did provide some jobs. But these were not enough to absorb all the job seekers. Unable to find jobs with better income in cities, many people started working as rickshaw pullers, vendors, construction workers, domestic servants, etc. With irregular small incomes, these people could not afford reasonable shelter. They started living in slums on the outskirts of the cities and the problems of poverty, largely a rural phenomenon also became a feature of urban India.
Another feature of high poverty rates has been the huge income inequalities. One of the major reasons for this is the unequal distribution of land and other resources. Despite many policies, we have not been able to tackle the issue of poverty. Major policy initiatives like land reforms which aimed at redistribution of assets in rural areas have not been implemented effectively by most of the state governments. Effective implementation of policy could have improved the life of millions of rural poor.
Many other socio-cultural and economic factors are also responsible for poverty. In order to fulfil social obligations and observe religious ceremonies, people in India, including the very poor, spend a lot of money and waste their hard earned income. Small farmers need money to buy agricultural inputs like seeds, fertilizer, pesticides, etc. Since poor people hardly have any savings, they borrow or accept loan at higher risk. Unable to repay because of poverty, they become victims of indebtedness. So the high level of indebtedness is both the cause and effect of poverty.
Observe some of the poor families around you and try to find the following:
- Which social and economic group do they belong to?
- Who are the earning members in the family?
- What is the condition of the old people in the family?
- Are all the children (both boys and girls) attending schools?
Anti-Poverty Measures
Removal of poverty has been one of the major objectives of Indian developmental strategy. The current anti-poverty strategy of the government is based broadly on two factors - (i) promotion of economic growth (ii) targeted antipoverty programmes.
Over a period of thirty years of independent India, lasting up to the early eighties, there were little per capita income growth and not much reduction in poverty. Official poverty estimates which were about 45 per cent in the early 1950s remained the same even in the early eighties. Since the eighties, India's economic growth has been one of the fastest in the world. The growth rate jumped from the average of about 3.5 per cent a year in the 1970s to about 6 per cent during the 1980s and 1990s. The two decades of 21st century (2000-2020) has also witnessed the rapid economic development. The higher growth rates have significantly helped in the reduction of poverty. Therefore, it is becoming clear that there is a strong link between economic growth and poverty reduction. Economic growth widens opportunities and provides the resources needed to invest in human development. This also encourages people to send their children, including the girl child, to schools in the hope of getting better economic returns by investing in education. The poor may not be able to take advantage from the opportunities created by economic growth. However, growth in the agriculture sector is much below expectations. This has a direct bearing on poverty. A large number of poor people live in villages and are dependent on agriculture.
In these circumstances, there is a clear need for targeted anti-poverty programmes. Although there are many schemes which are formulated to affect poverty directly or indirectly. Some of them are worth mentioning.
Mahatma Gandhi National Rural Employment Guarantee Act, 2005 aims to provide 100 days of wage employment to every household to ensure livelihood security in rural areas. It also aimed at sustainable development to address the cause of drought, deforestration and soil erosion. One-third of the proposed jobs have been reserved for women under this act. The wage rate for unskilled manual workers is revised regularly,
Pradhan Mantri Poshan Shakti Abhiyan (PM Poshan) is a flagship programme of Government of India. It was initiated with twin purpose - (i) to improve the nutritional requirement especially calorie and the protein intake of the child, (ii) improve the school enrolment and eliminate the drop out from the school. It targets students from Classes I to VIlI in Government, Government aided schools and special training centres under the Right to Education Act.
This scheme is implemented with the support of local governments and various community organisations. This programme encourages poor children, belonging to disadvantaged sections, to attend school more regularly and helps them concentrate on classroom activities.
Pradhan Mantri Surakshit Matritva Abhiyan was launched in 2016 with the aim to reduce maternal and infant mortality by providing quality antenatal care to the pregnant women throughout the country. The scheme works towards safe pregnancies, deliveries and addresses gaps in the service of the maternal care, to ensure constant and regular treatment to the beneficiaries. Services are provided on the ninth day of every month. This programme follows a systematic approach for engagement with private practitioners, motivating them to volunteer in the scheme at government health facilities.
Pradhan Mantri Ujjwala Yojana (PMUY) aims towards women empowerment in rural areas. It encourages the use of smoke-free kitchen, thereby, saving them from chronic respiratory disorders and poor eye sights. It was launched in 2016 with an aim to provide clean cooking fuel (liquefied petroleum gas or LPG) to economically poor households especially in the rural areas, who cook using traditional methods by using either coal, wood or cow dungs. Its target beneficiaries are Below Poverty Line (BPL) households, Scheduled Castes, Scheduled Tribes, forest dwellers and marginalised group households. To encourage the use of LPG, the scheme provides a completely free connection, including the first refill and a stove.
Over the years there is an increase in the LPG coverage throughout the country. Connections are issued in the name of the female member of the family. This scheme also promotes environment sustainability by reducing deforestation and carbon emission generated from burning coal and firewood. The use of clean cooking fuel, i.e., LPG means less time and effort in collecting firewood and encourages women to participate in social and economic activities.
The Challenges Ahead
Poverty has certainly declined in India. But despite the progress, poverty reduction remains India's most compelling challenge. Wide disparities in poverty are visible between rural and urban areas and among different States also. Certain social and economic groups are more vulnerable to poverty. Poverty reduction is expected to make better India. This would be possible mainly due to higher economic growth, increasing focus on universal education, declining population growth; empowerment of the women and the economically weaker sections of society would also facilitate the same.
The income based definition of poverty captures only a limited part of what poverty really means to people. It is about a 'minimum' subsistence level of living rather than a 'reasonable' level of living. Many scholars advocate that we must broaden the concept into human poverty. A large number of people may have been able to feed themselves. But do they have education? Or shelter? Or health care? Or job security? Or self-confidence? Are they free from caste and gender discrimination? Is the practice of child labour still common? Worldwide experience shows that with development, the definition of what constitutes poverty also changes. In this chapter we have looked at the different approaches to measure poverty. The National Multidimensional Poverty Index put forward by NITI Aayog reveals that the number and proportion of multidimensionally poor has declined in India. This may be due to the array of Government interventions initiated in recent years. What do you think?
In this chapter, we have looked at the different approaches of measuring poverty. The National Multidimensional Poverty Index, put forward by NITI Aayog in collaboration with UNDP and Oxford Policy and Human Development Initiative reveals that on the Headcount Ratio of multidimensionally poor, there has been a considerable reduction. Even when some of the states like Kerala and Tamil Nadu have reached less than 10 per cent on the HCR front, much is yet to be achieved by the other states. However, it is also to be noted that due to the array of Government intervention policies between 2005–06 and 2019–21 there has been significant decline in the number of MPI poor in the states of Bihar, Uttar Pradesh, Madhya Pradesh and Rajasthan.
Exercises
- How is the poverty line estimated in India?
- Do you think that the present methodology of poverty estimation is appropriate?
- Describe poverty trends in India since 1993.
- Discuss the major reasons for poverty in India.
- Give an account of interstate disparities of poverty in India.
- Describe global poverty trends.
- Describe the role of government in reducing poverty in India?
- What do you understand by human poverty?
- Who are the poorest of the poor?
- What are the main features of the Mahatma Gandhi National Rural Employment Guarantee Act 2005?
- Differentiate between consumption-based poverty line and NMP Index based poverty estimates.
- List the indicators used to estimate multidimensional poor in India.
References
Deaton, Angus and Valerie Kozel (Eds.) (2005). The Great Indian Poverty Debate. MacMillan India Limited, New Delhi.
Economic Survey 2015–2016. Ministry of Finance, Government of India, New Delhi.
(Chapter on social sectors)
[Online] URL: http://indiabudget.nic.in/es_2004_05/social.htmMid-Term Appraisal of the Tenth Five Year Plan 2002–2007. Planning Commission, New Delhi.
Part II, Chapter 7: Poverty Elimination and Rural Employment
[Online] URL: http://www.planningcommission.nic.in/midterm/english-pdf/chapter-07.pdfNITI Aayog (2023). National Multidimensional Poverty Index: A Progress Review 2023.
NITI Aayog, Government of India.Panagariya, Arvind and Vishal More (2013–14).
Poverty by social, religious and economic groups in India and its largest state.
Programme on Indian Economic Policies, Columbia University.Tenth Five Year Plan 2002–2007. Planning Commission, New Delhi.
Chapter 3.2: Poverty Alleviation in Rural India: Strategy and Programmes
[Online] URL: http://www.planningcommission.nic.in/plans/planrel/fiveyr/10th/volume2/v2_ch3_2.pdfWorld Development Indicators (2016).
Featuring the Sustainable Development Goals, The World Bank.UNDP (United Nations Development Programme) (2023).
Global Multidimensional Poverty Index (MPI): Unstacking global poverty: Data for high impact action. New York.