How Dynamic Graph Plotting Solves Common Calculus Doubts
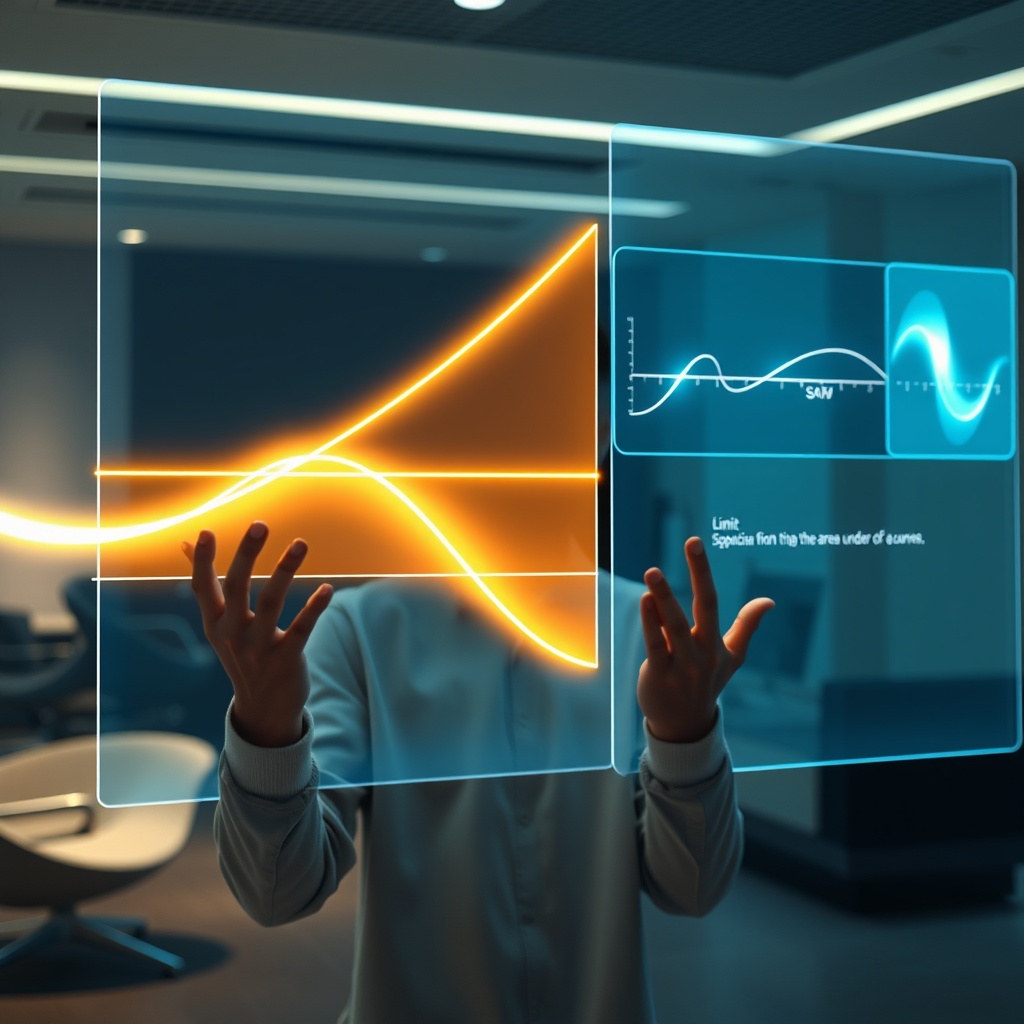
Many students grasp the algebraic rules for differentiation (e.g., the power rule for `x^n`) but struggle to connect this to the geometric meaning of a derivative as the slope of a tangent line. When faced with `f(x) = x^3 - 3x + 2`, identifying critical points where the slope is zero or understanding why the function increases then decreases without seeing its shape can feel abstract. This is precisely how watching a graph get plotted helps with Calculus doubts, providing an intuitive bridge between symbols and visual reality.
Overview
Many students grasp the algebraic rules for differentiation (e.g., the power rule for `x^n`) but struggle to connect this to the geometric meaning of a derivative as the slope of a tangent line. When faced with `f(x) = x^3 - 3x + 2`, identifying critical points where the slope is zero or understanding why the function increases then decreases without seeing its shape can feel abstract. This is precisely how watching a graph get plotted helps with Calculus doubts, providing an intuitive bridge between symbols and visual reality.
Traditional static textbook graphs only show the end result, not the dynamic process of how a function behaves as `x` changes. This lack of motion makes concepts like limits (approaching a point) or the accumulation in integration harder to internalize. YoLearn AI addresses this by providing interactive explanations and visualizations that simulate the plotting process, helping students see the 'why' behind the 'what' in Calculus.
History & Background
For decades, understanding calculus concepts like the relationship between a function and its derivative largely relied on static diagrams in textbooks or hand-drawn sketches by teachers. While effective for illustrating a point, these fixed images couldn't convey the continuous change inherent in calculus – the way a tangent line's slope smoothly varies, or how the area under a curve accumulates as its upper limit shifts.
The advent of graphing calculators and later, online tools like Desmos and GeoGebra, offered students the first taste of dynamic visualization. They could input a function and instantly see its graph, and even manipulate parameters. Now, AI tutors like YoLearn AI take this further by not just plotting the graph, but also explaining *why* it plots that way, or *how* a change in the function `f(x)` affects its visual representation, providing real-time, context-aware insights.
Benefits
Using YoLearn AI specifically for graph plotting in Calculus offers unique advantages:
Applications
YoLearn AI enhances this visual understanding in several ways:
Future
The future of understanding Calculus through visualization will likely involve more immersive and interactive environments. Imagine tools that allow students to manipulate a function's parameters via gesture or voice command and instantly see its graph morph in 3D, perhaps even 'walking' along a curve to feel its slope.
YoLearn AI is moving towards even more dynamic and personalized visual learning experiences. This includes deeper integration of interactive plotting tools within explanations, allowing students to experiment with functions and instantly see AI-driven feedback on their graphical interpretations. Whether you're a CBSE student trying to visualize `y=x^3` or a JEE aspirant grappling with complex implicit differentiation graphs, YoLearn AI aims to make every concept clear. How YoLearn.ai AI Tutor Helps CBSE Students Thrive. Start exploring Calculus visually today: https://play.google.com/store/apps/details?id=com.yolearn.student&hl=en_IN